Physical Color#
Source file: examples/physical_color.py
Output#
Code#
import numpy as np, sys, matplotlib.pyplot as plt, matplotlib.gridspec as gridspec
from optable import *
# 1. Setup Data
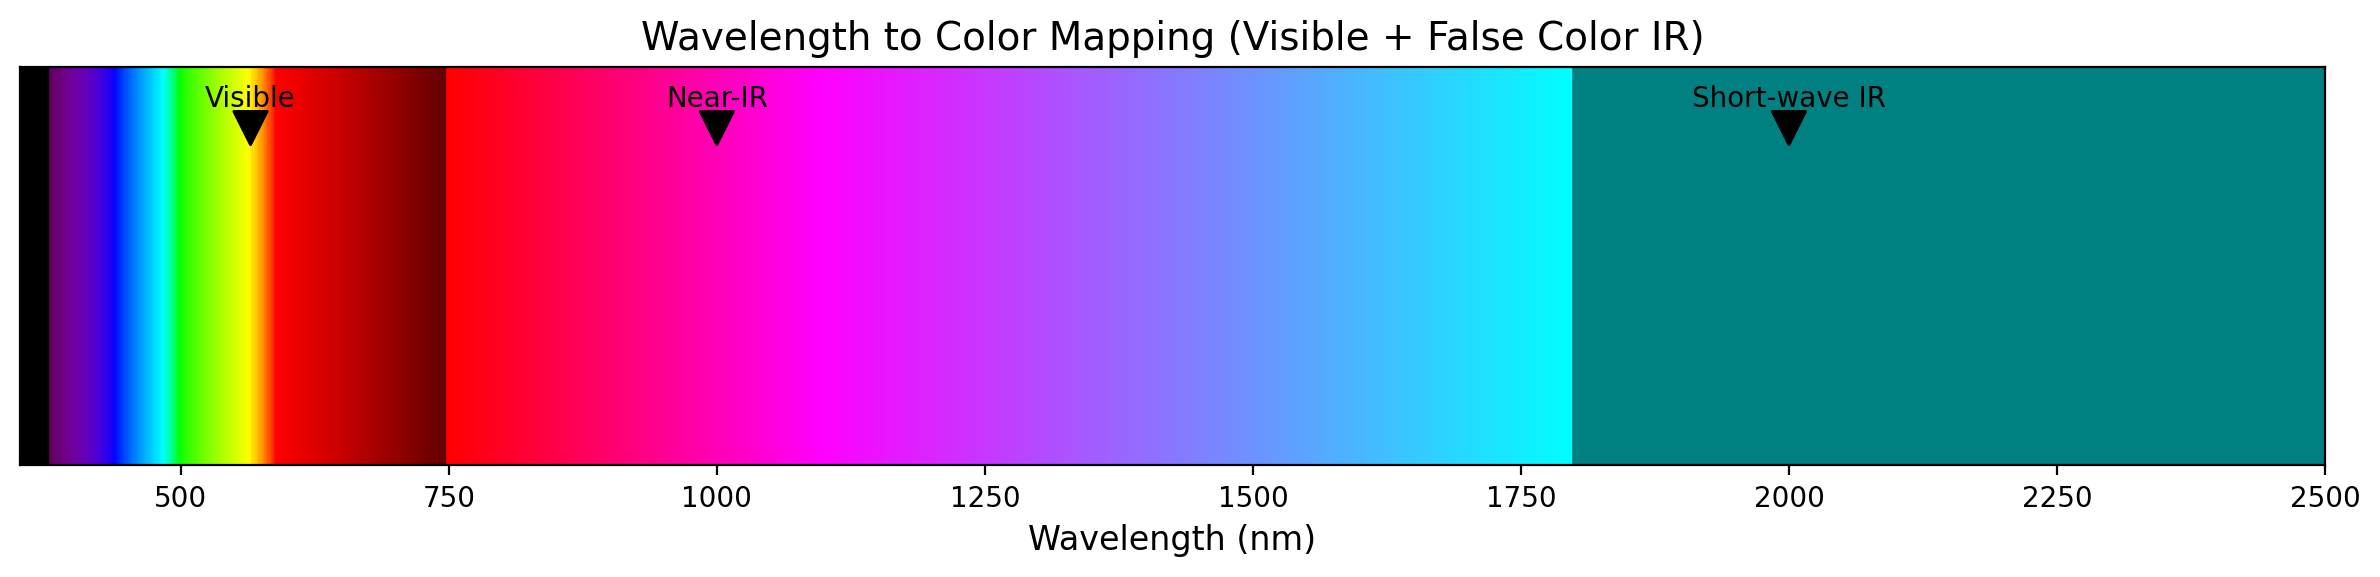
wavelengths = np.linspace(350, 2500, 1000)
colors = [wavelength_to_rgb(w * 1e-9) for w in wavelengths]
# 2. Create the Plot
fig, ax = plt.subplots(figsize=(12, 3))
for i, w in enumerate(wavelengths):
ax.axvline(x=w, color=colors[i], linewidth=2)
# 3. Formatting
ax.set_xlim(350, 2500)
ax.set_ylim(0, 1)
ax.set_yticks([])
ax.set_xlabel("Wavelength (nm)", fontsize=12)
ax.set_title("Wavelength to Color Mapping (Visible + False Color IR)", fontsize=14)
# 4. Add Labels
ax.annotate(
"Visible",
xy=(565, 0.8),
xytext=(565, 0.9),
ha="center",
arrowprops=dict(facecolor="black", shrink=0.05),
)
ax.annotate(
"Near-IR",
xy=(1000, 0.8),
xytext=(1000, 0.9),
ha="center",
arrowprops=dict(facecolor="black", shrink=0.05),
)
ax.annotate(
"Short-wave IR",
xy=(2000, 0.8),
xytext=(2000, 0.9),
ha="center",
arrowprops=dict(facecolor="black", shrink=0.05),
)
plt.tight_layout()
plt.show()