Gaussian Telescope#
Source file: examples/gaussian_telescope.py
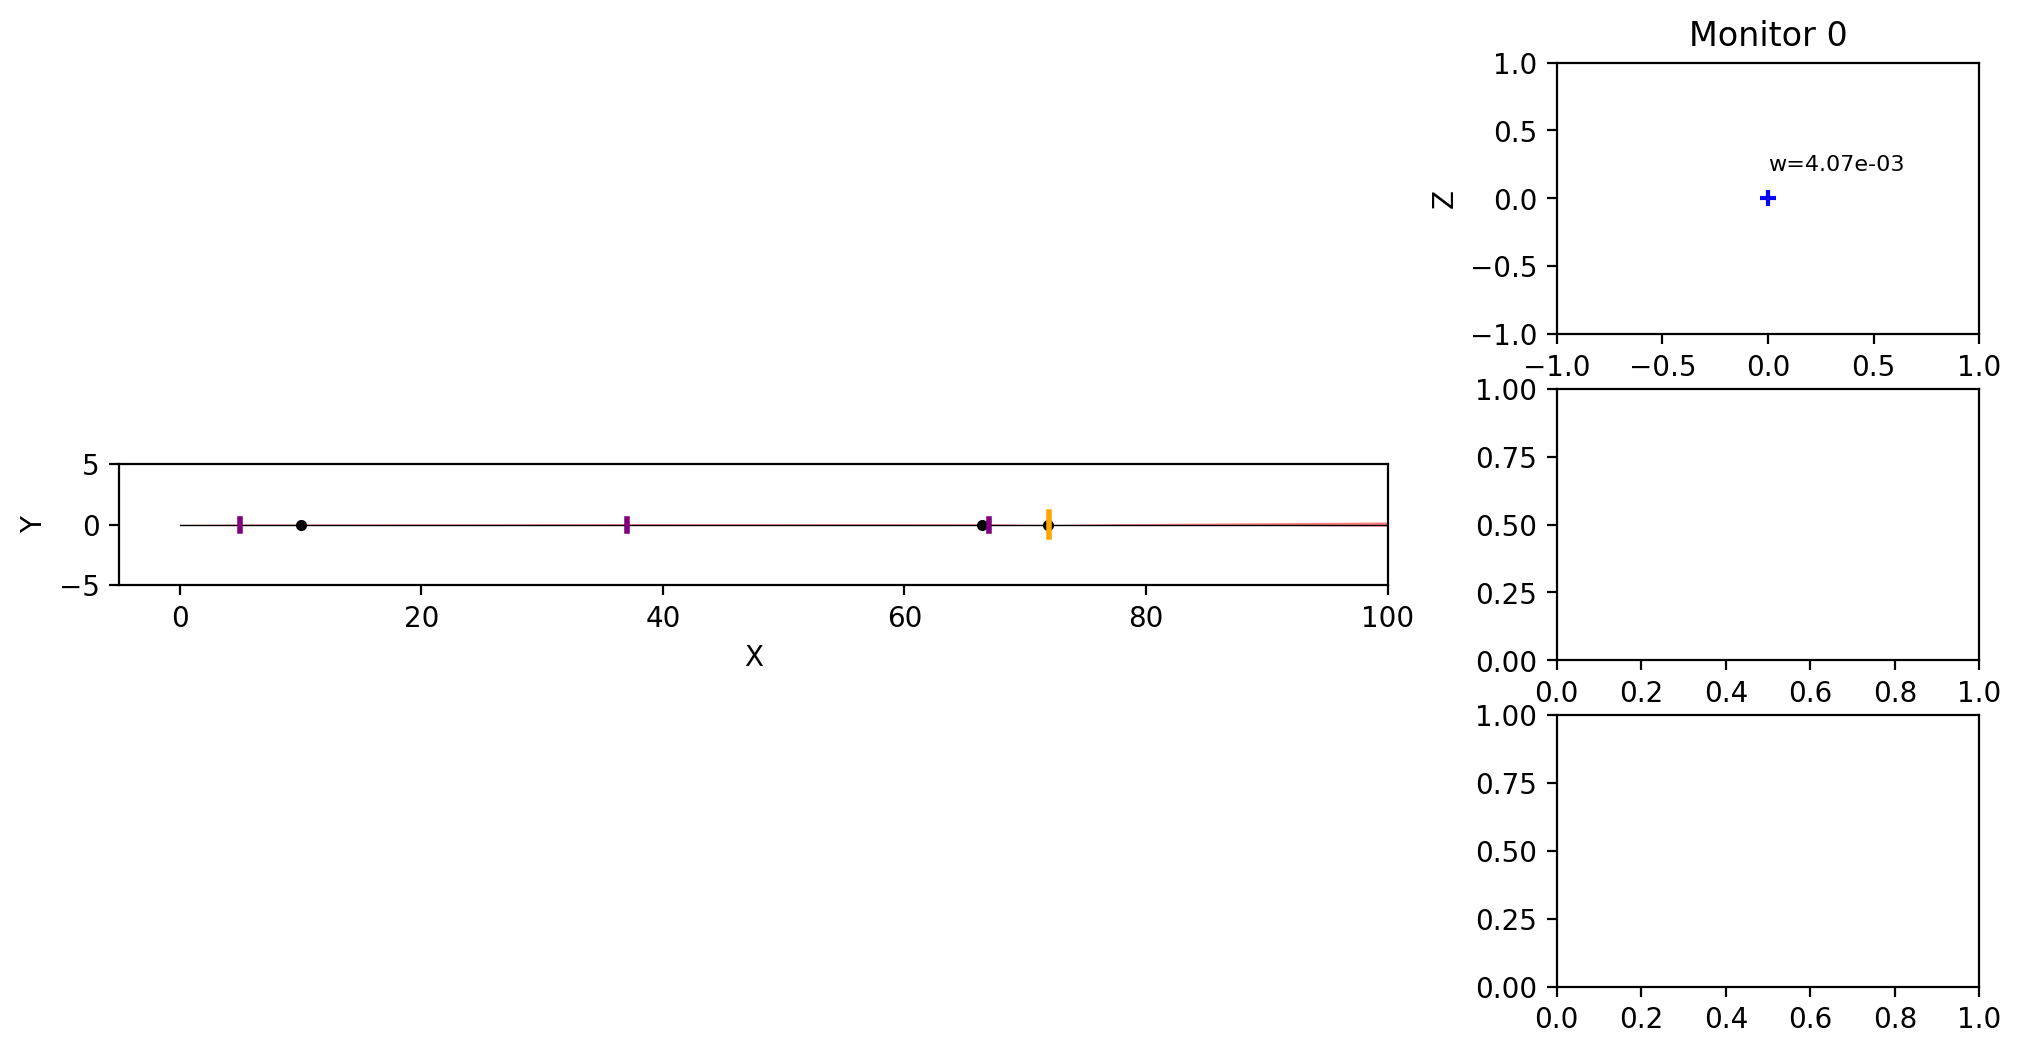
Output#
Code#
import numpy as np, sys, matplotlib.pyplot as plt, matplotlib.gridspec as gridspec
from optable import *

PLOT_TYPE = "Z"  # "Z" or "3D"
# PLOT_TYPE = "3D"  # "Z" or "3D"

if __name__ == "__main__":
    # plot3d
    fig = plt.figure(figsize=(12, 6))
    gs = gridspec.GridSpec(1, 2, width_ratios=[3, 1])
    ax0 = plt.subplot(gs[0], projection="3d" if PLOT_TYPE == "3D" else None)
    gs1 = gridspec.GridSpecFromSubplotSpec(3, 1, subplot_spec=gs[1])
    ax1 = [plt.subplot(gs1[i]) for i in range(3)]


sol0 = {"dx1": [0.0, -1, 1], "dx3": [0.0, -1, 1]}

vars = sol0
for var, val in vars.items():
    if var not in locals():
        exec(f"{var} = {val[0]}")

F = 5
M = 5
D = 2
F0 = F
F1 = F / M
F2 = F * M
F3 = F
l0 = Lens([F0 + dx1, 0, 0], focal_length=F0, diameter=D, name="Lens 0")
l1 = Lens([2 * F0 + F1 + dx1, 0, 0], focal_length=F1, diameter=D, name="Lens 1")
l2 = Lens(
    [2 * F0 + 2 * F1 + F2 + dx3, 0, 0], focal_length=F2, diameter=D, name="Lens 2"
)
l3 = Lens(
    [2 * F0 + 2 * F1 + 2 * F2 + F3 + dx3, 0, 0],
    focal_length=F3,
    diameter=D,
    name="Lens 3",
)


mon0 = Monitor(
    [2 * F0 + 2 * F1 + 2 * F2 + 2 * F3, 0, 0], width=D, height=D, name="Monitor 0"
)

rays = [Ray([0, 0, 0], [1, 0, 0], wavelength=780e-7, w0=61e-4)]


components = [l0, l2, l3]

table = OpticalTable()
table.add_components(components)
table.add_monitors([mon0])
table.ray_tracing(rays)

table.render(
    ax0,
    type=PLOT_TYPE,
    roi=[-5, 100, -5, 5, -5, 5],
    gaussian_beam=True,
)
mon0.render_scatter(
    ax1[0],
    gaussian_beam=True,
    annote_waist=True,
)

if __name__ == "__main__":
    # plt.axis("off")
    # plt.savefig("gaussian_beam.png", dpi=300, bbox_inches="tight")
    plt.show()