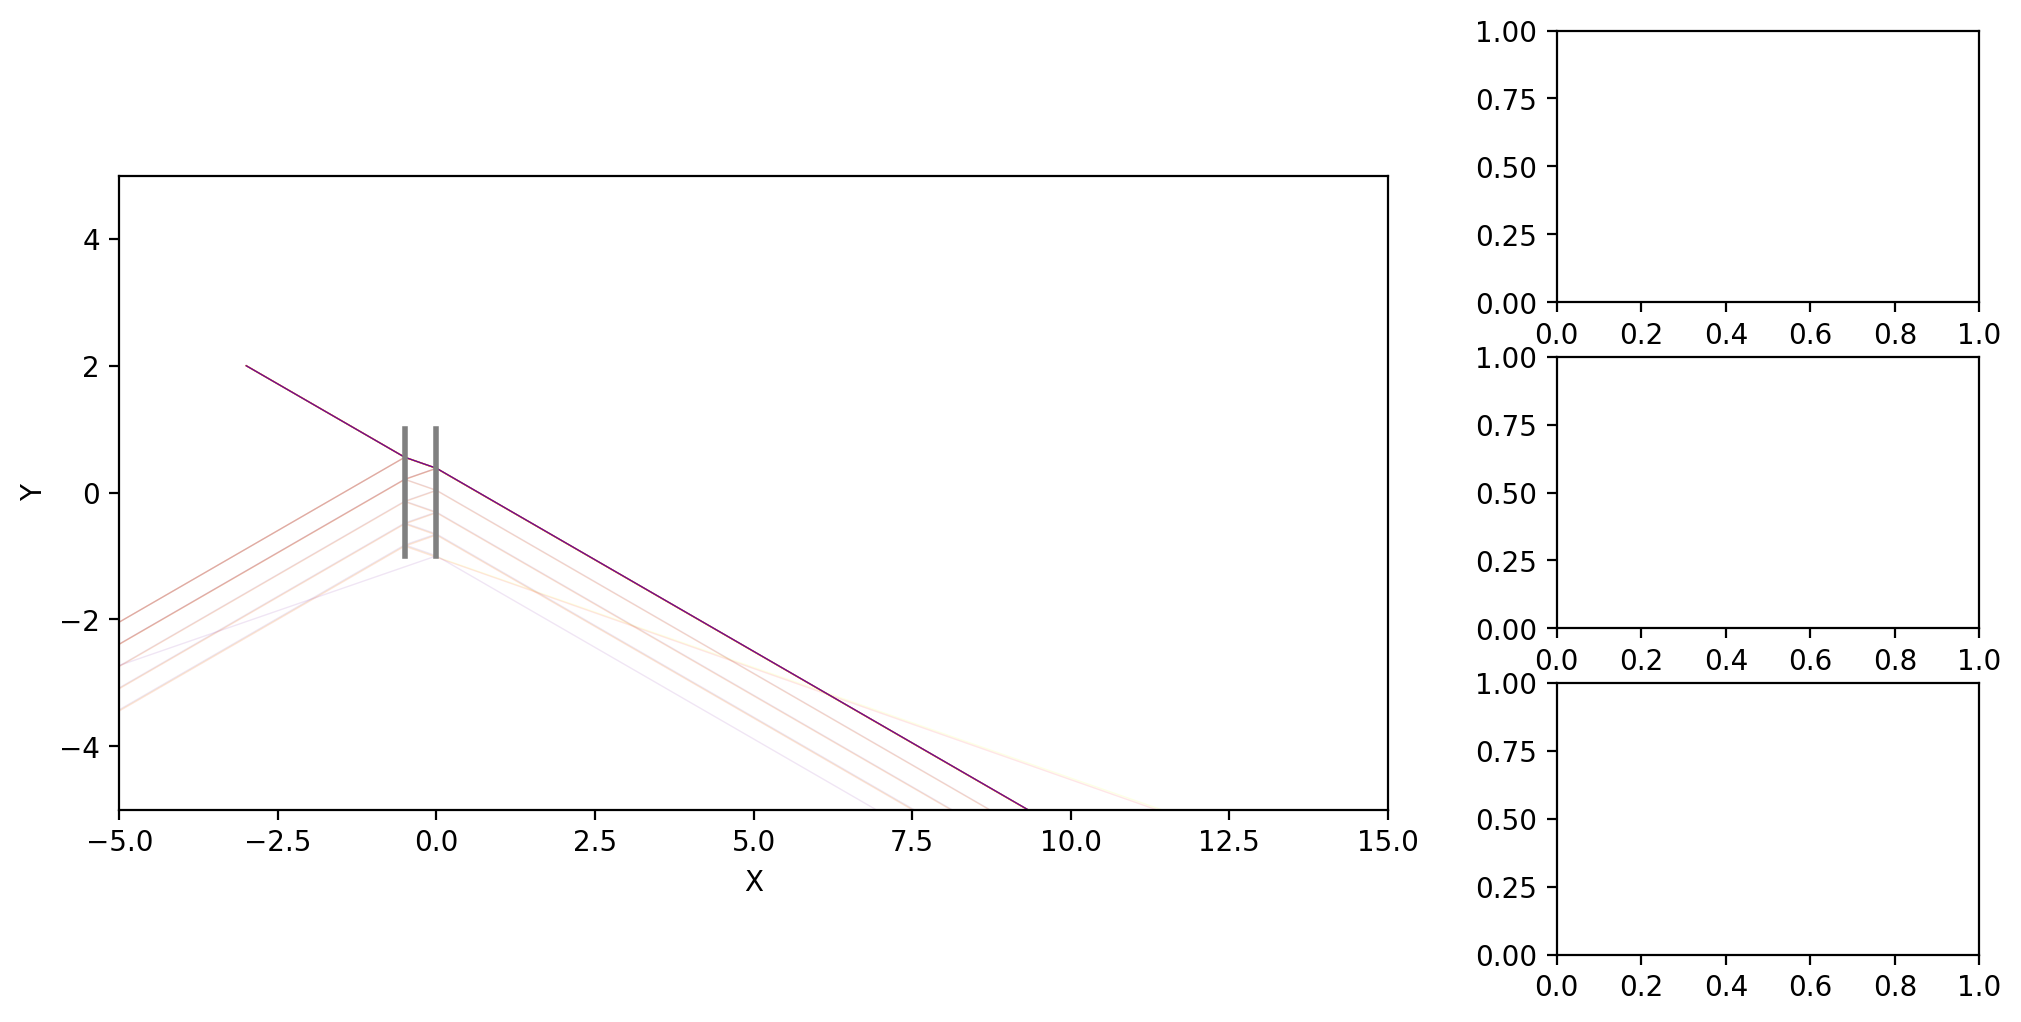
Chromatic Aberration#
Source file: examples/chromatic_aberration.py
Output#
Code#
import numpy as np, sys, matplotlib.pyplot as plt, matplotlib.gridspec as gridspec
from optable import *

PLOT_TYPE = "Z"  # "Z" or "3D"
# PLOT_TYPE = "3D"  # "Z" or "3D"

if __name__ == "__main__":
    # plot3d
    fig = plt.figure(figsize=(12, 6))
    gs = gridspec.GridSpec(1, 2, width_ratios=[3, 1])
    ax0 = plt.subplot(gs[0], projection="3d" if PLOT_TYPE == "3D" else None)
    gs1 = gridspec.GridSpecFromSubplotSpec(3, 1, subplot_spec=gs[1])
    ax1 = [plt.subplot(gs1[i]) for i in range(3)]


r0 = [
    Ray(
        [-3, 2, 0],
        [np.cos(np.pi / 6), -np.sin(np.pi / 6), 0],
        wavelength=780e-7,
        w0=20e-4,
    ).Propagate(-2),
]
L = 2
D = 0.5
rays = multiplex_rays_in_wavelength(r0, [780e-7, 560e-7, 400e-7])

gs = GlassSlab(
    [0, 0, 0],
    width=L,
    height=L,
    thickness=D,
    n1=Vacuum(),
    n2=Glass_NBK7(),
    reflectivity=0.2,
)
components = [gs]
table = OpticalTable()
table.add_components(components)
table.ray_tracing(rays)
table.render(
    ax0,
    type=PLOT_TYPE,
    roi=(-5, 15, -5, 5, -5, 5),
    # gaussian_beam=True,
    physical_color=True,
)


if __name__ == "__main__":
    plt.show()